Dr Toby Benzecry Shares a Sneak Peek into his Doctorate Research
Workplace research tells us that office moves can have unpredictable effects, sometimes negligible, sometimes transformational.
This is a graph of the annual turnover of one of our clients over a thirteen-year period. At the beginning of Year 10, something happened that completely transformed the business and sales quadrupled in four years. They moved office.
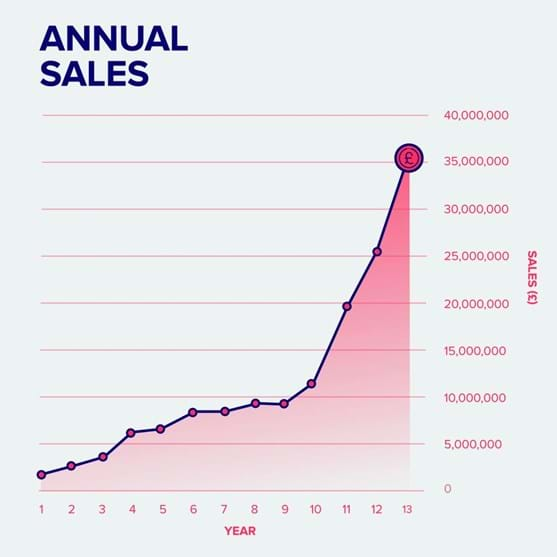
So where did this extraordinary change in performance come from? The workplace industry wants you to believe that “worker productivity” is the key, and that this has everything to do with the design of the office. Try Googling “office design for productivity” and see. But this type of thinking was debunked in the mid-twentieth century with the Hawthorne experiments involving factory workers. No link could be found between productivity and the environment, and this was with workers whose outputs could actually be measured. How do you decide how productive an office worker is?
I have spent thirty years creating workplaces for companies, and the last four years researching the question of why some organisations that move to new offices experience extremely positive transformative effects, whilst others less so. And, spoiler alert, it turns out to have little to do with whether the new office is open plan, brightly coloured, full of plants or has a slide. In fact, two businesses moving to almost identically designed offices can experience completely different results. There is nothing in the formula of office design that necessarily leads to a greater return on investment.
What I did find was something far more nuanced and, in many respects, much more interesting. When a company moves to a new office, the event sits within a two-dimensional grid that I call the shift diagram.
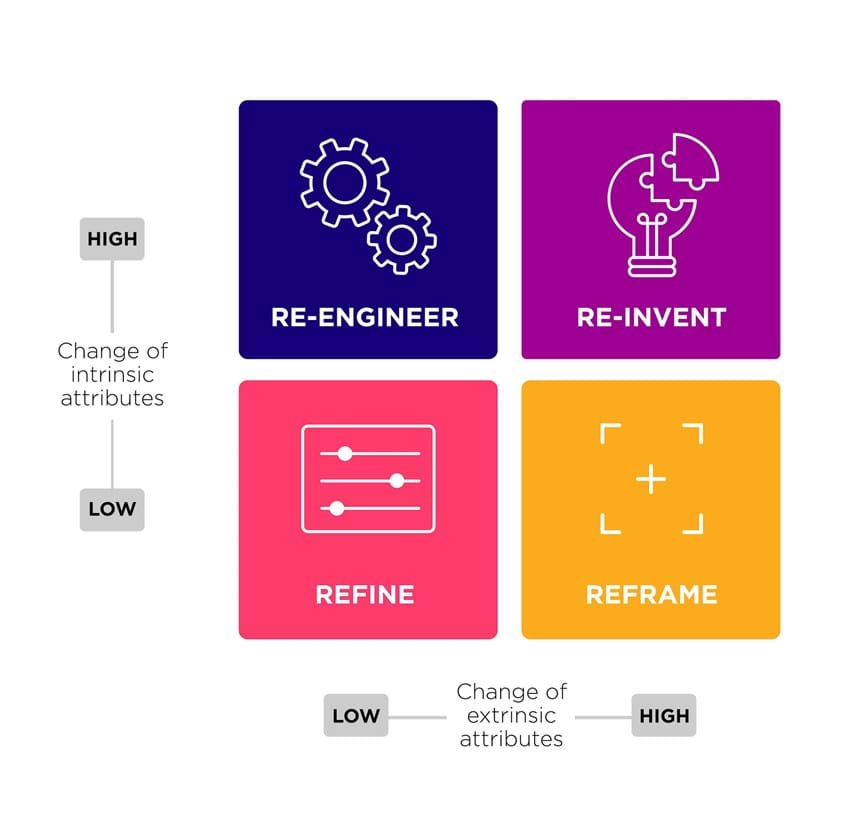
The horizontal axis shows the degree of change of extrinsic attributes – the features of the office that come with its location (commute, quality of the building, the neighbourhood, other tenants, the views); these are things that can be selected from a number of options, but not otherwise influenced. The vertical axis shows the degree of change of intrinsic attributes – the features of the workplace itself (its interior design, spatial arrangements, furnishings, IT, facilities); these are the things that a company can influence and typically designs and implements itself (or might have some say over if moving to pre-fitted space).
It turns out that the position of a project on the shift diagram is highly predictive of its probability of creating transformative results for the company. However, the story doesn’t end there: using a quasi-statistical method known as fuzzy set qualitative comparative analysis (fsQCA) I was able to establish which moderating factors were necessary or sufficient to create the conditions for success.
The results are fascinating and, I believe, will fundamentally change the way we think about the influence of physical space on organisational performance, and reshape how we approach workplace research moving forward.
If you want to know how Toby’s workplace research could help your organisation, get in touch today.

